|
Jungo WinDriver
Official Documentation
|
|
Jungo WinDriver
Official Documentation
|
The following sections describe how to debug your hardware-access application code.
Since WinDriver is accessed from the user mode, we recommend that you first debug your code using your standard debugging software, such as the compiler’s debugger.
Debug Monitor is a powerful graphical- and console-mode tool for monitoring all activities handled by the WinDriver kernel. You can use this tool to monitor how each command sent to the kernel is executed.
In addition, WinDriver enables you to print your own debug messages to the Debug Monitor, using the WD_DebugAdd() function or the high-level PrintDbgMessage() function. Note that this function can be called from both user-mode and kernel-mode code (created using WinDriver’s Kernel PlugIn feature) and can also be called from within functions running at HIGH IRQL, such as the Kernel PlugIn KP_IntAtIrql() function.
The Debug Monitor comes in two versions:
wddebug_gui — a GUI versionwddebug — a console-mode versionNote that wddebug_gui is available for all supported Desktop operating system but is currently not available for Linux ARM/ARM64. For these platforms, use the console-mode wddebug.
Both Debug Monitor versions are provided in the WinDriver/util directory.
Please note that WD_DebugAdd() function can be called from both user-mode and kernel-mode code (created using WinDriver’s Kernel PlugIn feature) and can also be called from within functions running at HIGH IRQL, such as the Kernel PlugIn KP_IntAtIrql() function.
You can also select to send the debug messages to a kernel debugger, instead of to the Debug Monitor log, as we explain further. This can enable you, for example, to log the debug message on another PC in case the system crashes (BSOD) or hangs on the development PC.
Most of the WinDriver functions have a return value to indicate success or a relevant error code, which can assist you in the debugging process. The return status codes are defined in the [WD_ERROR_CODES] (WD_ERROR_CODES) enum.
When developing code in the kernel using the Kernel PlugIn, you can also use any kernel debugger in the debugging process (e.g., WinDbg — which is distributed with the Windows Driver Kit (WDK) and is part of the Debugging Tools for Windows package, distributed via the Microsoft website). As mentioned above, you can also select to direct the debug message from the Debug Monitor to a kernel debugger of your choice.
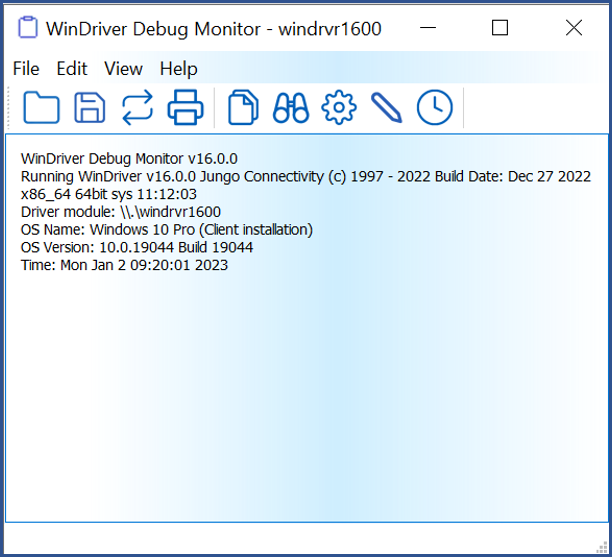
The Debug Monitor utility logs debug messages from WinDriver's kernel-mode and usermode APIs. You can also use WinDriver APIs to send your own debug messages to the Debug Monitor log.
When using WinDriver's API (such as WD_Transfer()), to read/write memory ranges on the card in the kernel, while the Debug Monitor is activated, WinDriver's kernel module validates the memory ranges, i.e., it verifies that the reading/writing from/to the memory is in the range that is defined for the card.
Use DriverWizard to check values of memory, registers and configuration in the debugging process.
wddebug_gui is a fully graphical (GUI) version of the Debug Monitor utility for Windows and Linux.
WinDriver/util/wddebug_gui.Start Debug Monitor
Debug Options
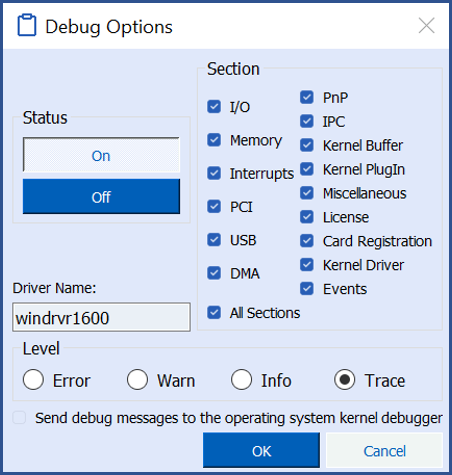
Status — Set trace on or off. Section — Choose what part of the WinDriver API you would like to monitor.
For example, if you are experiencing problems with the interrupt handler on your PCI card, select the PCI and Interrupts sections. USB developers should select the USB section.
Choose carefully those sections that you would like to monitor. Checking more options than necessary could result in an overflow of information, making it harder for you to locate your problem.
Level — Choose the level of messages you want to see for the resources defined. Error is the lowest trace level, resulting in minimum output to the screen. Trace is the highest trace level, displaying every operation the WinDriver kernel performs. Send debug messages to the operating system kernel debugger — Select this option to send the debug messages received from the WinDriver kernel module to an external kernel debugger, in addition to the Debug Monitor.
On Windows, the first time that you enable this option you will need to restart the PC. A free Windows kernel debugger, WinDbg, is distributed with the Windows Driver Kit (WDK) and is part of the Debugging Tools for Windows package, distributed via the Microsoft web site. Driver Name — This field displays the name of the driver currently being debugged. Changing it allows you to debug a renamed WinDriver driver.
When debugging OS crashes or hangs, it's useful to auto-save the Debug Monitor log, via the File | Toggle Auto-Save menu option (available also via a toolbar icon), in addition to sending the debug messages to the OS kernel debugger.
You can use the Edit | Add Custom Message... menu option (available also via a toolbar icon) to add custom messages to the log. This is especially useful for clearly marking different execution sections in the log.
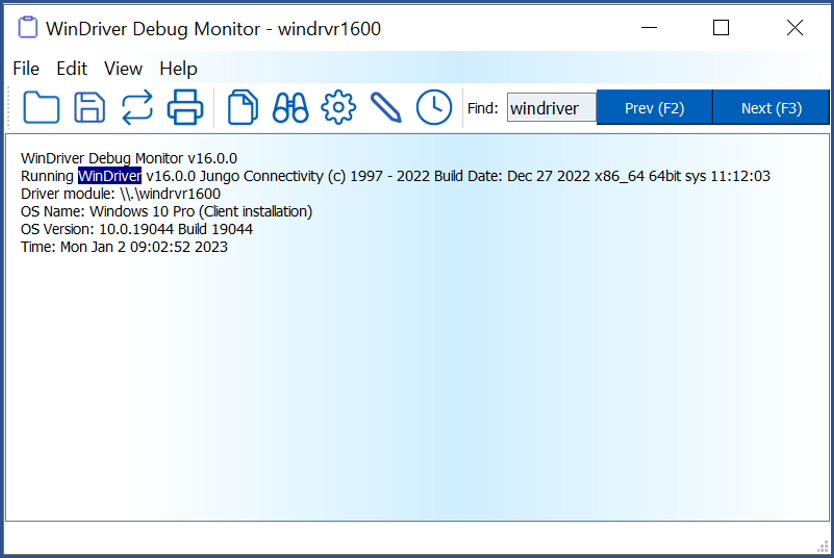
wddebug_gui allows to find expressions in the Debug output in 4 ways:
If an expression is found it is marked. It is possible to browse between occurences of an expression using Prev (F2) and Next (F3).
Search in wddebug_gui
In driver development, it is not uncommon to experience kernel crashes that lead to the Blue Screen of Death (BSOD). In order to assist developers in debugging and solving these crashes, WinDriver allows saving its kernel debug messages in the memory dump that Windows automatically creates when the system crashes. These crash dumps can later be opened in wddebug_gui after the system was restarted.
To direct the debug messages to a kernel debugger, follow these steps:
wddebug_gui (available on Windows, Linux, and MacOS), check the “Send debug messages to the operating system kernel debugger” option in the Debug Options window, and press ‘OK’.wddebug (available on all the supported operating systems) — with the dbg_on command:windrvr1630.pdb). Do not skip this step, otherwise the kernel dump might not be comprehensible.wddebug_gui will display the output from the crash dump.Windows users can use Microsoft’s WinDbg tool, for example, this tool is distributed with the Windows Driver Kit (WDK) and is part of the Debugging Tools for Windows package, distributed via the Microsoft web site.
By default, wddebug_gui logs messages from the default WinDriver kernel module — windrvr1630.sys/.dll/.o/.ko. However, you can also use wddebug_gui to log debug messages from a renamed version of this driver see Chapter 17: Driver Installation — Advanced Issues, in two ways:
wddebug_gui, by going to View | **Debug Options and changing the value of the "Driver name" field to your own renamed driver's name.wddebug_gui from the command line with the driver_name argument:The driver name should be set to the name of the driver file without the file's extension, e.g., windrvr1630, not windrvr1630.sys (on Windows) or windrvr1630.o (on Linux). For example, if you have renamed the default windrvr1630.sys driver on Windows to my_driver.sys, you can log messages from your driver by running the Debug Monitor using the following command:
The wddebug version of the Debug Monitor utility can be executed as a console-mode application on all supported operating systems: Windows, and Linux. To use the console-mode Debug Monitor version, run WinDriver/util/wddebug in the manner explained below.
wddebug console-mode usage
The wddebug arguments must be provided in the order in which they appear in the usage statement above.
<driver_name> — The name of the driver to which to apply the command.The driver name should be set to the name of the WinDriver kernel module — windrvr1630 (default), or a renamed version of this driver (refer to the explanation in 17.2. Renaming the WinDriver Kernel Driver). We remind that the driver name should be set to the name of the driver file without the file's extension, e.g., windrvr1630, not windrvr1630.sys (on Windows) or windrvr1630.o (on Linux).
<command>— The Debug Monitor command to execute.Activation commands:
| Command | Description |
|---|---|
on | Turn the Debug Monitor on. |
off | Turn the Debug Monitor off. |
dbg_on | Redirect the debug messages from the Debug Monitor to a kernel debugger and turn the Debug Monitor on (if it was not already turned on). On Windows, the first time that you enable this option you may need to restart the PC. The on and dbg_on commands can be used together with the <level> and <sections> arguments. |
dbg_off | Stop redirecting debug messages from the Debug Monitor to a kernel debugger. |
dump | Continuously send ("dump") debug information to the command prompt, until the user selects to stop (by following the instructions displayed in the command prompt). |
status | Display information regarding the running driver (<driver_name>), the current Debug Monitor status — including the active debug level and sections (when the Debug Monitor is on) — and the size of the debug-messages buffer. |
clock_on | Add a timestamp to each debug message. The timestamps are relative to the driver-load time, or to the time of the last clock_reset command. |
clock_off | Do not add timestamps to the debug messages. |
clock_reset | Reset the debug-messages timestamps clock. |
sect_info_on | Add section(s) information to each debug message. |
sect_info_off | Do not add section(s) information to the debug messages. |
help | Display usage instructions. |
| No arguments (including no commands) | This is equivalent to running 'wddebug help'. |
The following arguments are applicable only with the on or dbg_on commands:
| Argument | Description |
|---|---|
<level> | The debug trace level to set — one of the following flags: ERROR, WARN, INFO, or TRACE (default). ERROR is the lowest trace level and TRACE is the highest level (displays all messages). When the <sections> argument is set, the <level> argument must be set as well (no default). |
<sections> | The debug sections — i.e., the WinDriver API sections — to monitor. |
This argument can be set either to ALL (default) — to monitor all the supported debug sections — or to a quoted string that contains a combination of any of the supported debug-section flags (run 'wddebug help' to see the full list).
Usage Sequence
To log messages using wddebug, use the following sequence:
You can use the <level> and <sections> arguments to set the debug level and sections for the log. If these arguments are not explicitly set, the default values will be used; (note that if you set the sections you must also set the level). You can also log messages from a renamed WinDriver driver by preceding the command with the name of the driver (default: windrvr1630) — see the <driver_name> argument.
dbg_on command), run wddebug with the dump command to begin dumping debug messages to the command prompt.You can turn off the display of the debug messages, at any time, by following the instructions displayed in the command prompt.
status, clock_on, clock_off, clock_reset, sect_info_on, or sect_info_off.on or dbg_on with different <level> and/or <sections> arguments.dbg_on and dbg_off — to toggle the redirection of debug messages to the OS kernel debugger.dump — to start a new dump of the debug log to the command prompt; (the dump can be stopped at any time by following the instructions in the prompt)off command.The status command can be used to view information regarding the running WinDriver driver even when the Debug Monitor is off.
Example
The following is an example of a typical wddebug usage sequence. Since no <driver_name> is set, the commands are applied to the default driver — windrvr1630.
Turn the Debug Monitor on with the highest trace level for all sections:
This is the same as running wddebug on TRACE, because ALL is the default <sections> value. Then dump the debug messages continuously to the command prompt or a file, until the user selects to stop:
Following that use the driver and view the debug messages in the command prompt. Turn the Debug Monitor off:
In order to debug your WinDriver application and driver a machine that does not have WinDriver installed on it:
WinDriver\util\wddebug.exe to your testing machine.wddebug dump from your target machine's command line.wddebug utility using CTRL+C.So why use wddebug_gui?
The GUI version offers easier search options and is more comfortable to use on modern desktop operating systems.
And why use wddebug?
wdapi1630.dll/.so).WinDriver/samples/c/wddebug. This allows you greater flexibility in modifying this application for your specific debugging needs. Jungo does not provide the source code for wddebug_gui.wddebug is easier to use in scripts, or remote console sessions such as PowerShell, SSH, etc.Yes! The code of the device driver you write runs in normal Win32 user mode. Therefore, you can compile and debug your code using MS Visual Studio. Generally, WinDriver-based user-code can be debugged on any IDE that allows compiling C/C++ applications in Windows.
Besides using wddebug_gui / wddebug as described in this chapter, we also recommend using the following tools when needed:
valgrind (Linux) / Dr. Memory (Windows) for locating memory leaks.WinDriver/src/wdapi.WinDbg / WinDbg Preview. More info on how to set these up is available on MSDN. In Linux/MacOS you can use dmesg to view kernel panics. MacOS also provides crash dumps for every application or kernel crash in a designated directory (Usually ~/Library/Logs).